-
1Situation
-
2Writing

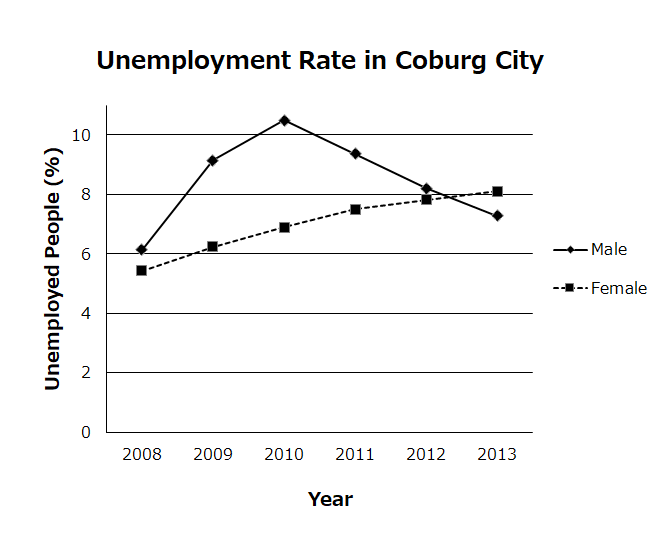
Using the information in the graph, describe how the unemployment rate of each gender group changed over time and point out important details.
You should write about 70 words.
- COPY
- CUT
- PASTE
Word Count:0
You cannot return to this page.

Using the information in the graph, describe how the unemployment rate of each gender group changed over time and point out important details.
You should write about 70 words.